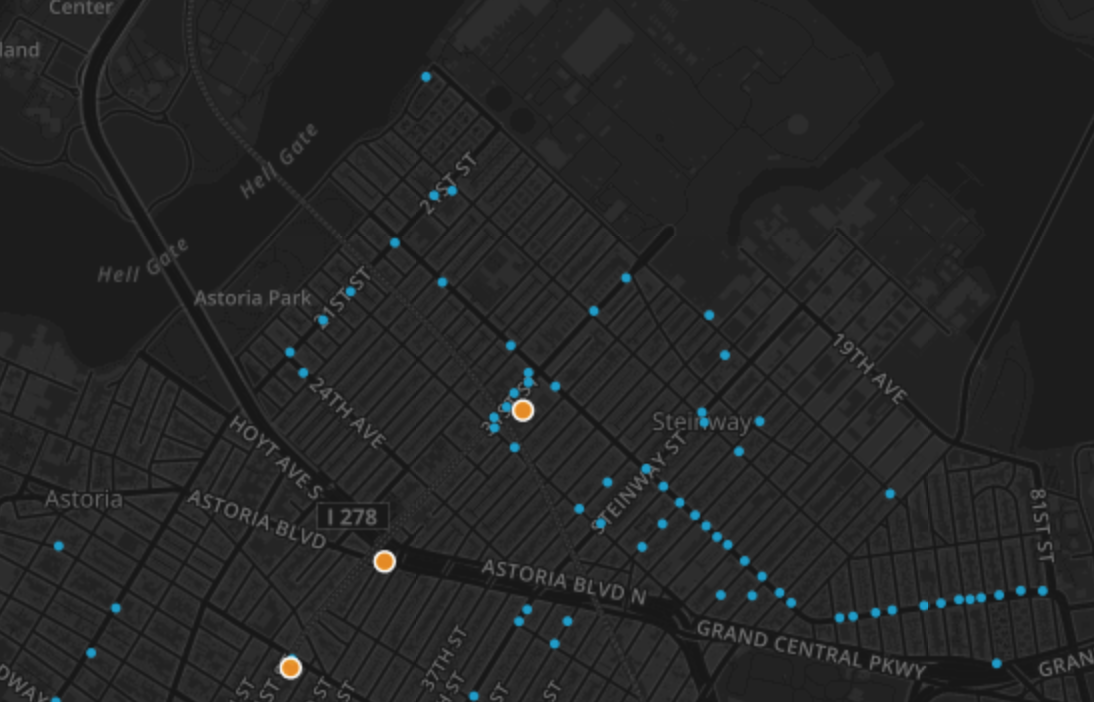
Uncovering Hidden Transit Demand
Using Mapbox and Carto to visualize rush hour taxi shares. See the main app here and an explanatory blog post here

Using Mapbox and Carto to visualize rush hour taxi shares. See the main app here and an explanatory blog post here
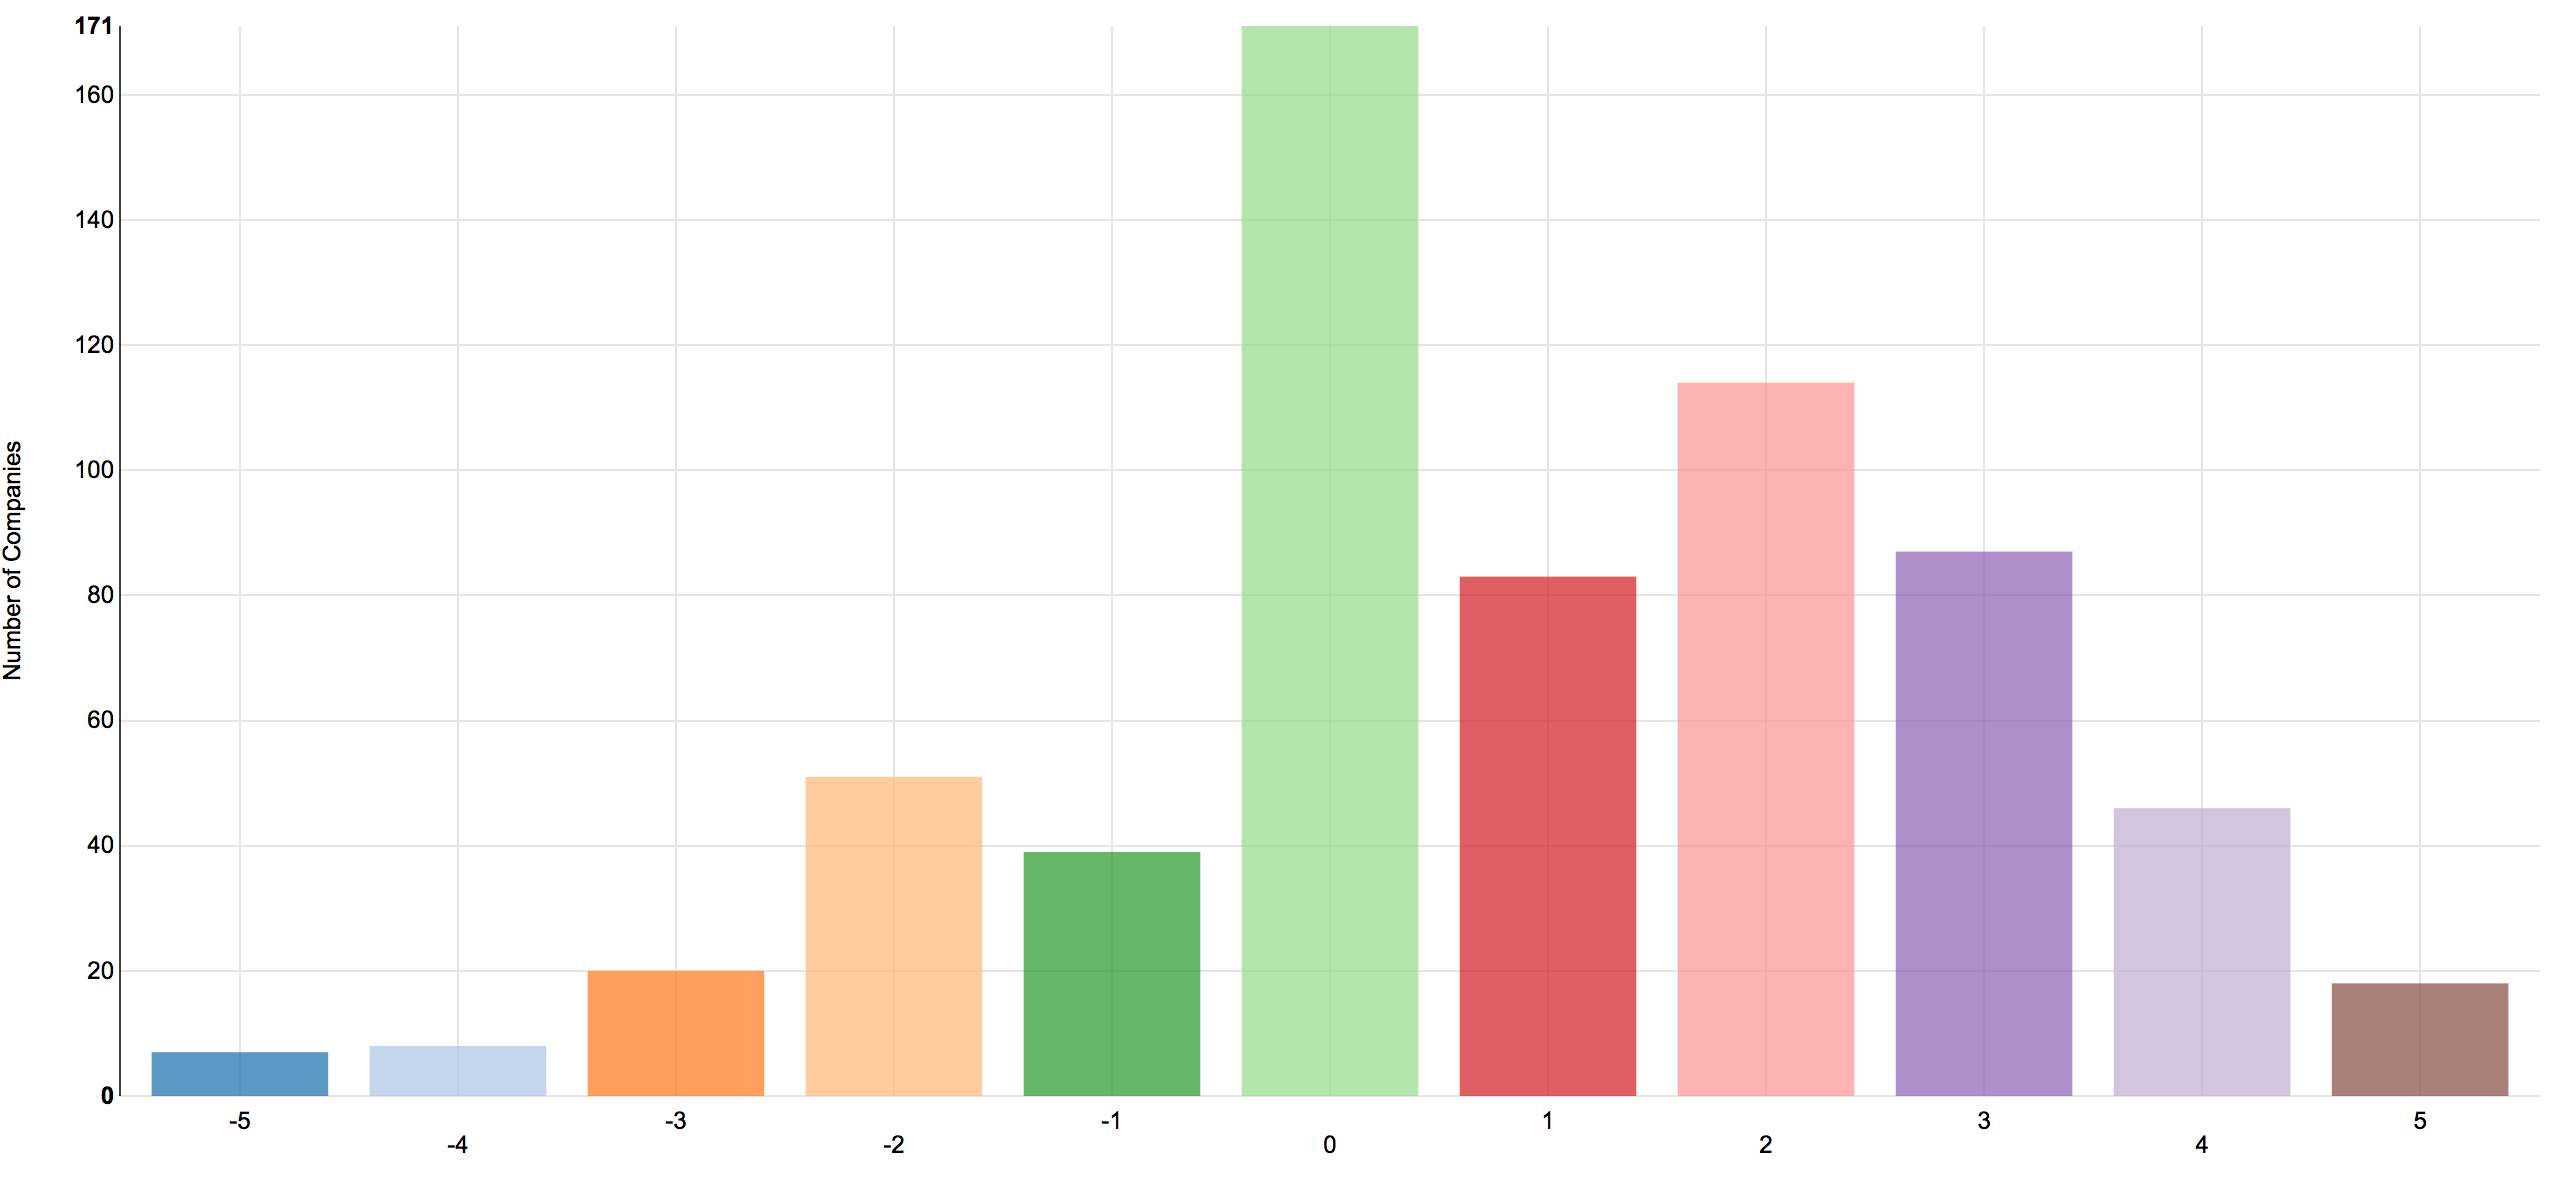
My entry for the Bank of England's 2015 data visualization competition, a part of their One Bank Research agenda. My entry, combining a narrative form with interactivity, can be found here
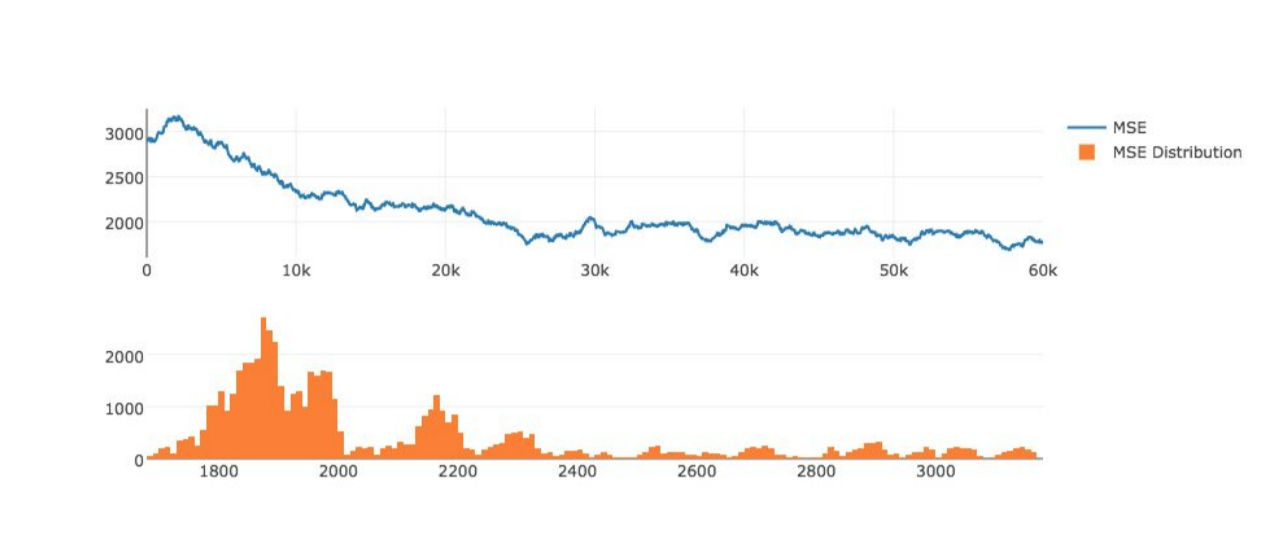
My master's thesis. Building on my earlier work of applying a novel Markov Chain Monte Carlo method to population dynamics, I propose a framework for simulating bike share demand. Paper can be read here
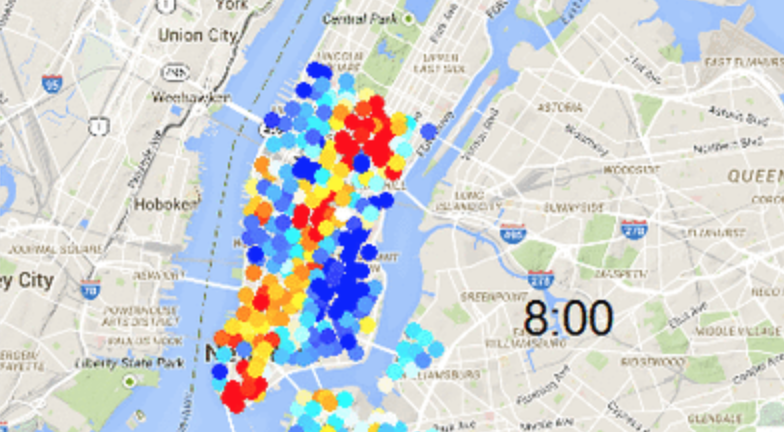
By aggregating trip level data put out by CitiBike, I was able to animate a typical day's demand, clearly showing bike share's unique commuting patterns. Explanatory blog post can be found here

Client case study. This is an add-on program for the EViews Econometric Programming platform, created as a client proof of concept while working with IHS Markit. Program can be found here
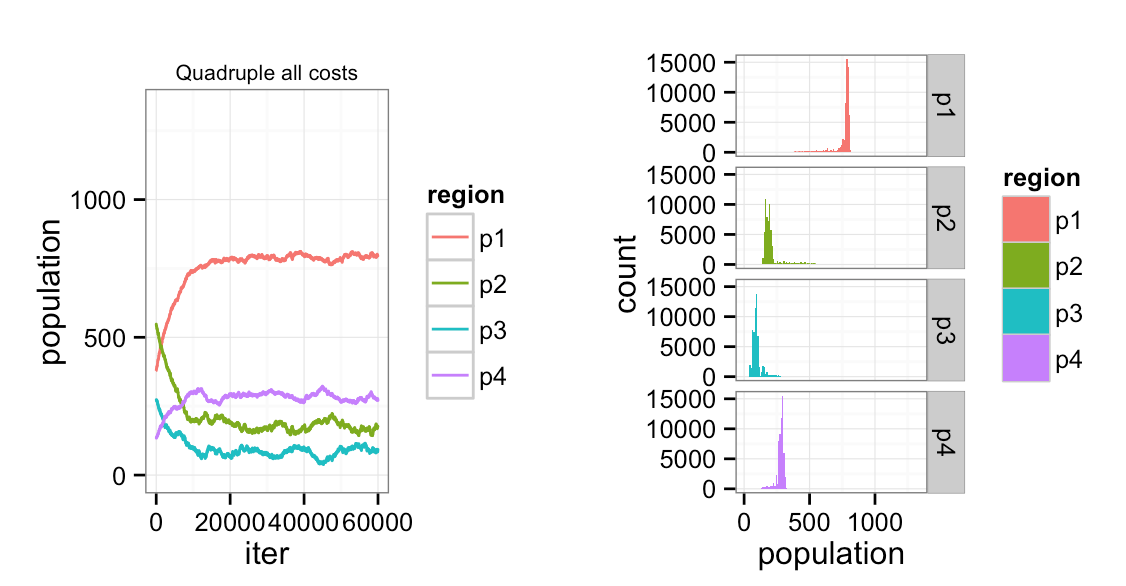
Building on previous work from Pan and Nagurney, I and my co-authors suggest a novel framework that more clearly models individual migration decisions. Paper can be found here